Sampson C. Ipiankama

Data Analyst

They say "when life gives you lemons make lemonade". At the start of second quarter of 2021, life gave me "lemons" and so I became a data analyst. I am a BI and data analyst with the super power to turn data into information, information into insight, and insight into business decisions.

My Skills

  • Data Management
  • Dataviz
  • Recent Projects

    Employee Attrition Analysis with Python

    Attrition in human resources refers to the departure of staff for any reason from a company over time. The impact of attrition on a company can be detrimental to both the bottom line and morale. It leads to the reduction of talent in the workforce. Replacing employees can be expensive too as the company has to go through the hiring processes, paperwork, and new hire training. Other costs of attrition include decreased productivity and profit to the company. To decrease attrition, managers must understand the causes of customer and employee turnover, the costs associated with attrition, and finally, institute measures to reduce attrition rates.

    The goal of the project was to understand the factors that influence an employee to leave the company. The tools I utilized:

    • Python
    • Numpy
    • Pandas
    • Matplotlib
    • Seaborn
    • Jupyter Notebook

    Sales Analysis with Python

    In this project, I used python pandas, matplotlib, seaborn,and numpy library packages to analyze and answer 5 business questions about a Superstore sales data. The data contains hundreds of thousands of super store purchases broken down by month, product line, branch, quantity,cost of goods(cogs) etc.

    The business questions I asked.

    • What was the best month for sales and how much was earned that month?
    • Which city sold the most product?
    • What time should we display advertisements to maximize likelihood of customer’s buying products?
    • What is the best payment channel by city?
    • Which product line sold the most and why do you think it did?

    COVID-19 Vaccination Information in Africa Dashboard with Tableau

    The global goal of fully vaccinating 10% of every country’s population by 30 September was set in May by the World Health Assembly, the world’s highest health policy-setting body. Almost 90% of high income-countries have met this target. In Africa, most of the countries that have met the goal have relatively small populations and 40% are small island developing states. For example, Seychelles and Mauritius have fully vaccinated over 72% of their populations, Morocco 52% and Tunisia 33%, Comoros 18% and Cape Verde 25% as at 10th October, 2021.

    The goal of this project was to analyze and explore information on the Covid-19 vaccination in Africa. The tools I utilized:

    • Tableau Public
    • Excel/CSV

    Web Scraping Projects

    Click on the image to view my web scraping projects done with BeautifulSoup and Selenium. Some of these projects include:

    • Amazon product listings
    • Real estate price comparison
    • Car dealership
    • Job listings
    • ... and many more

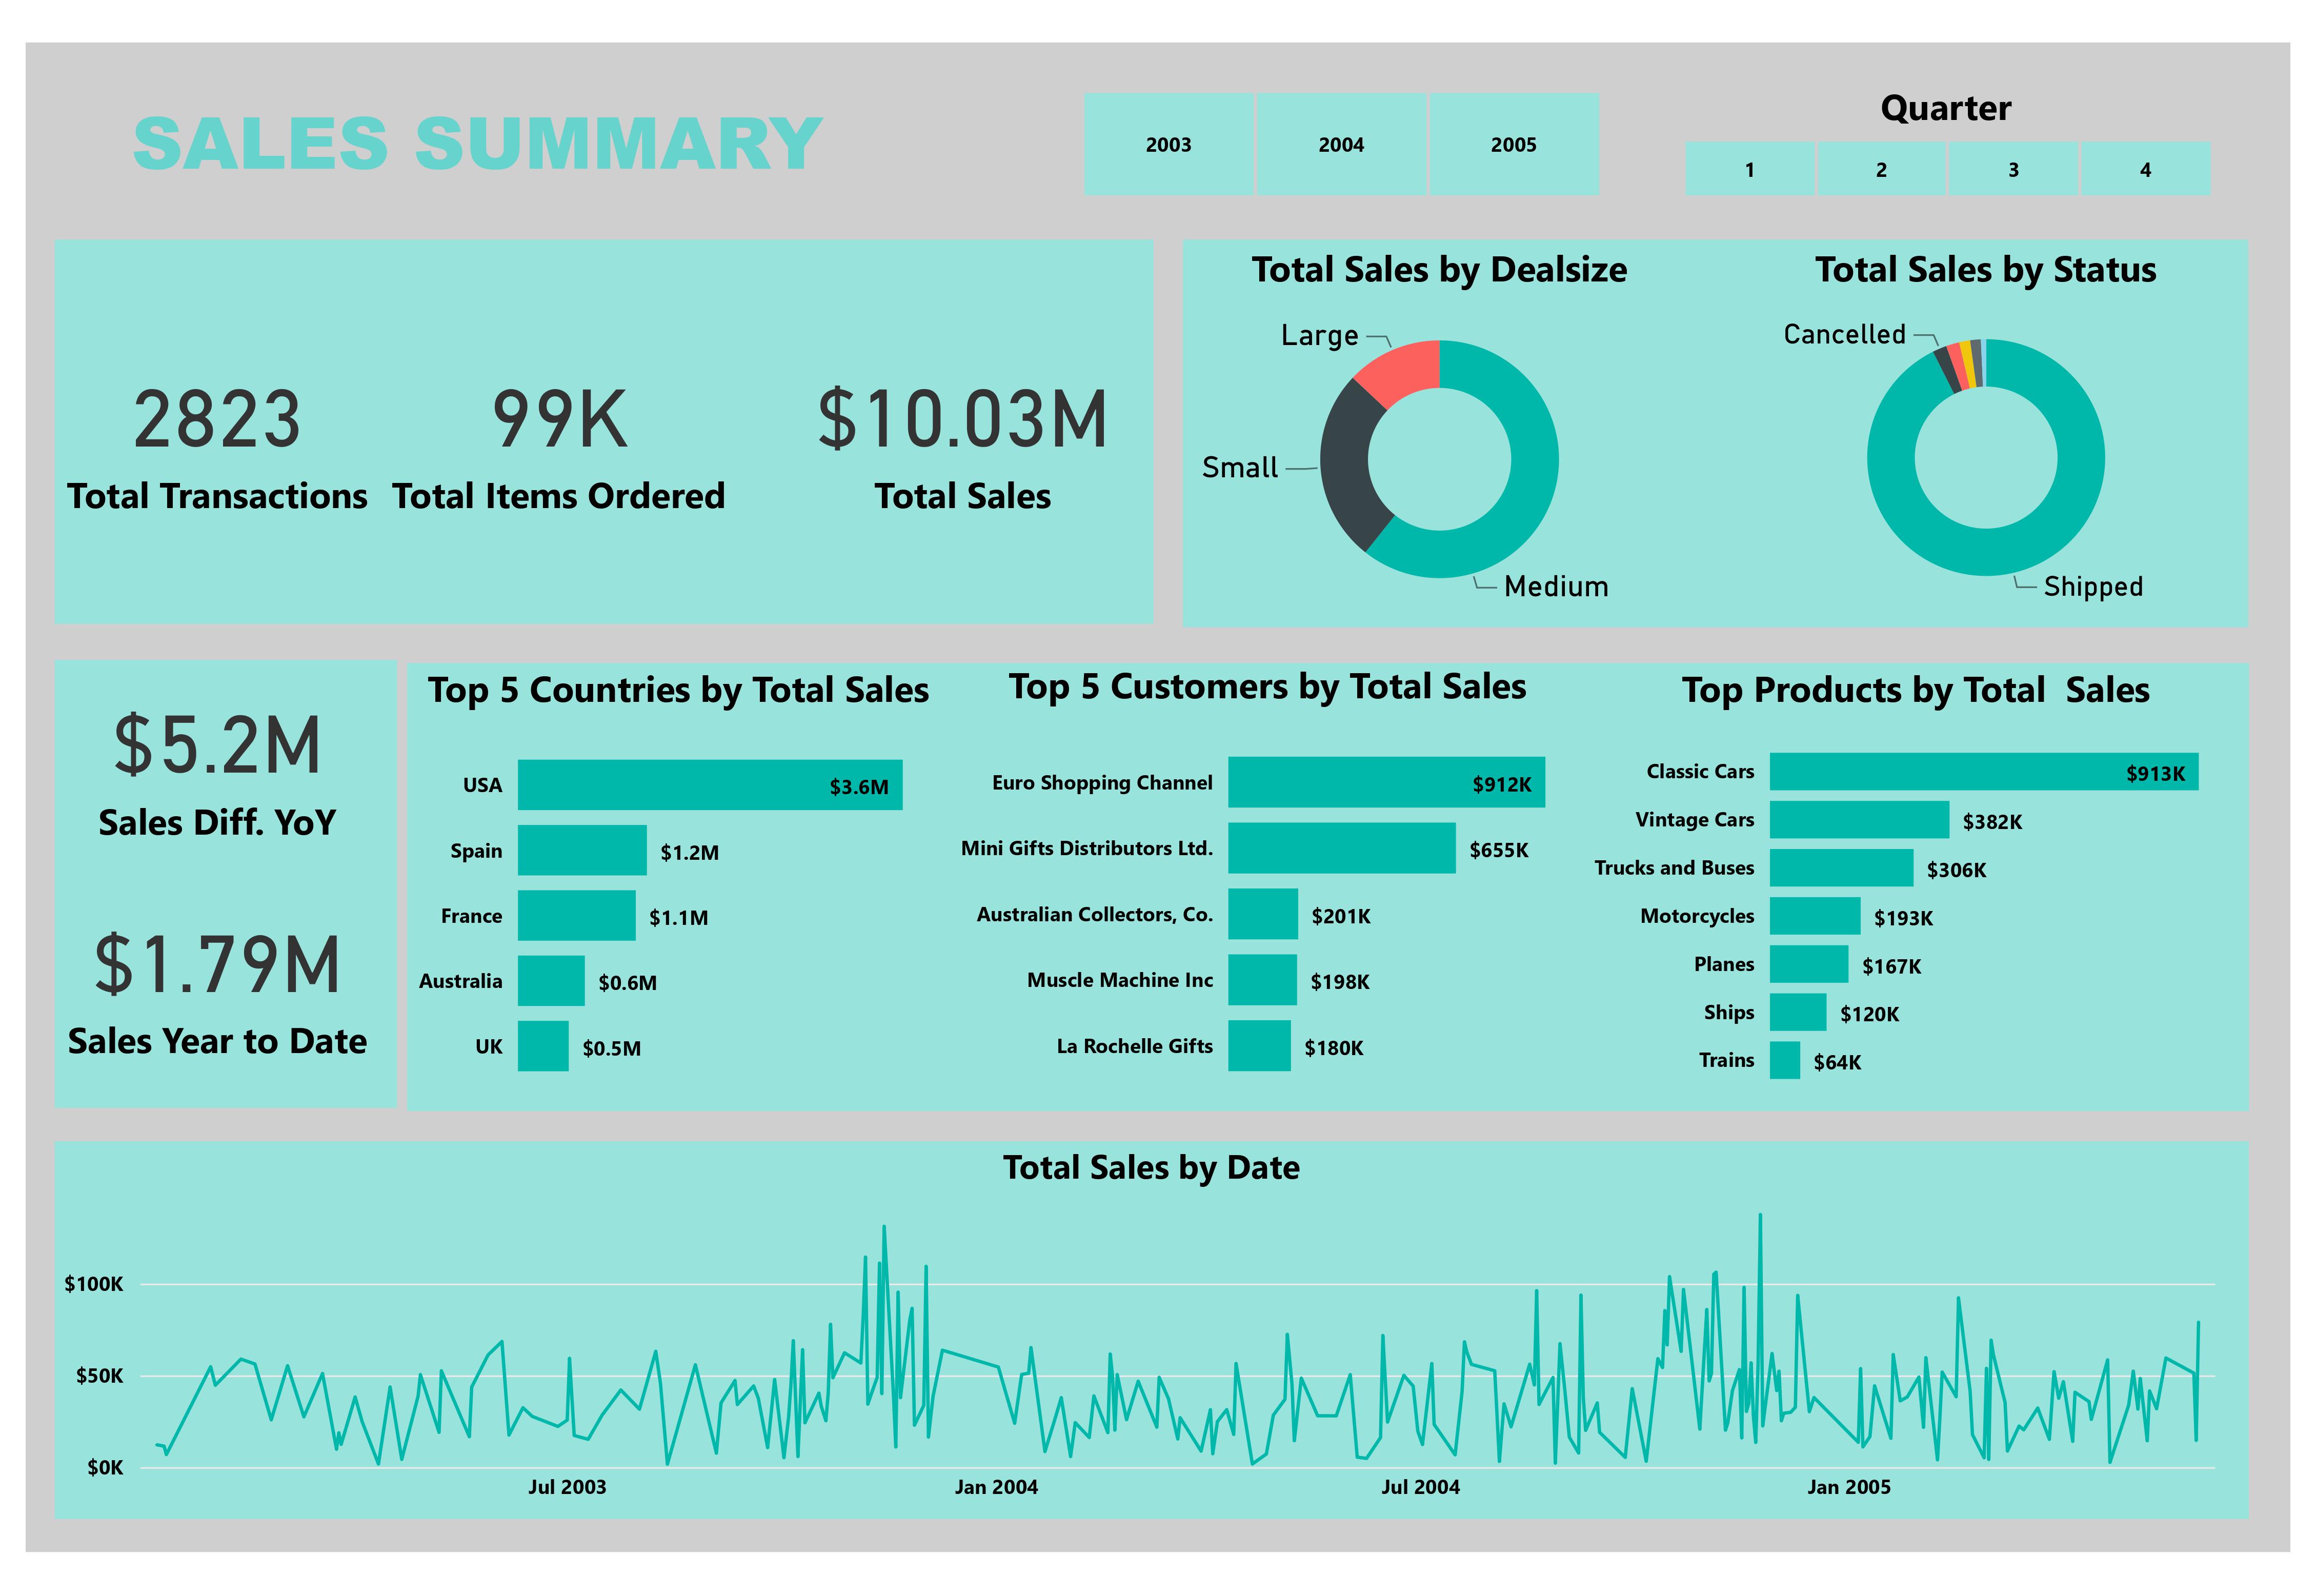
    Sales Summary Dashboard with Microsoft Power BI

    The objective of this project was to provide the retail store owner with insights to enable them quickly identify their hottest leads, gain deeper insight into buyer behavior, and drive engagements that close deals.

    The tools I utilized:

    • Power BI
    • DAX
    • Excel/CSV

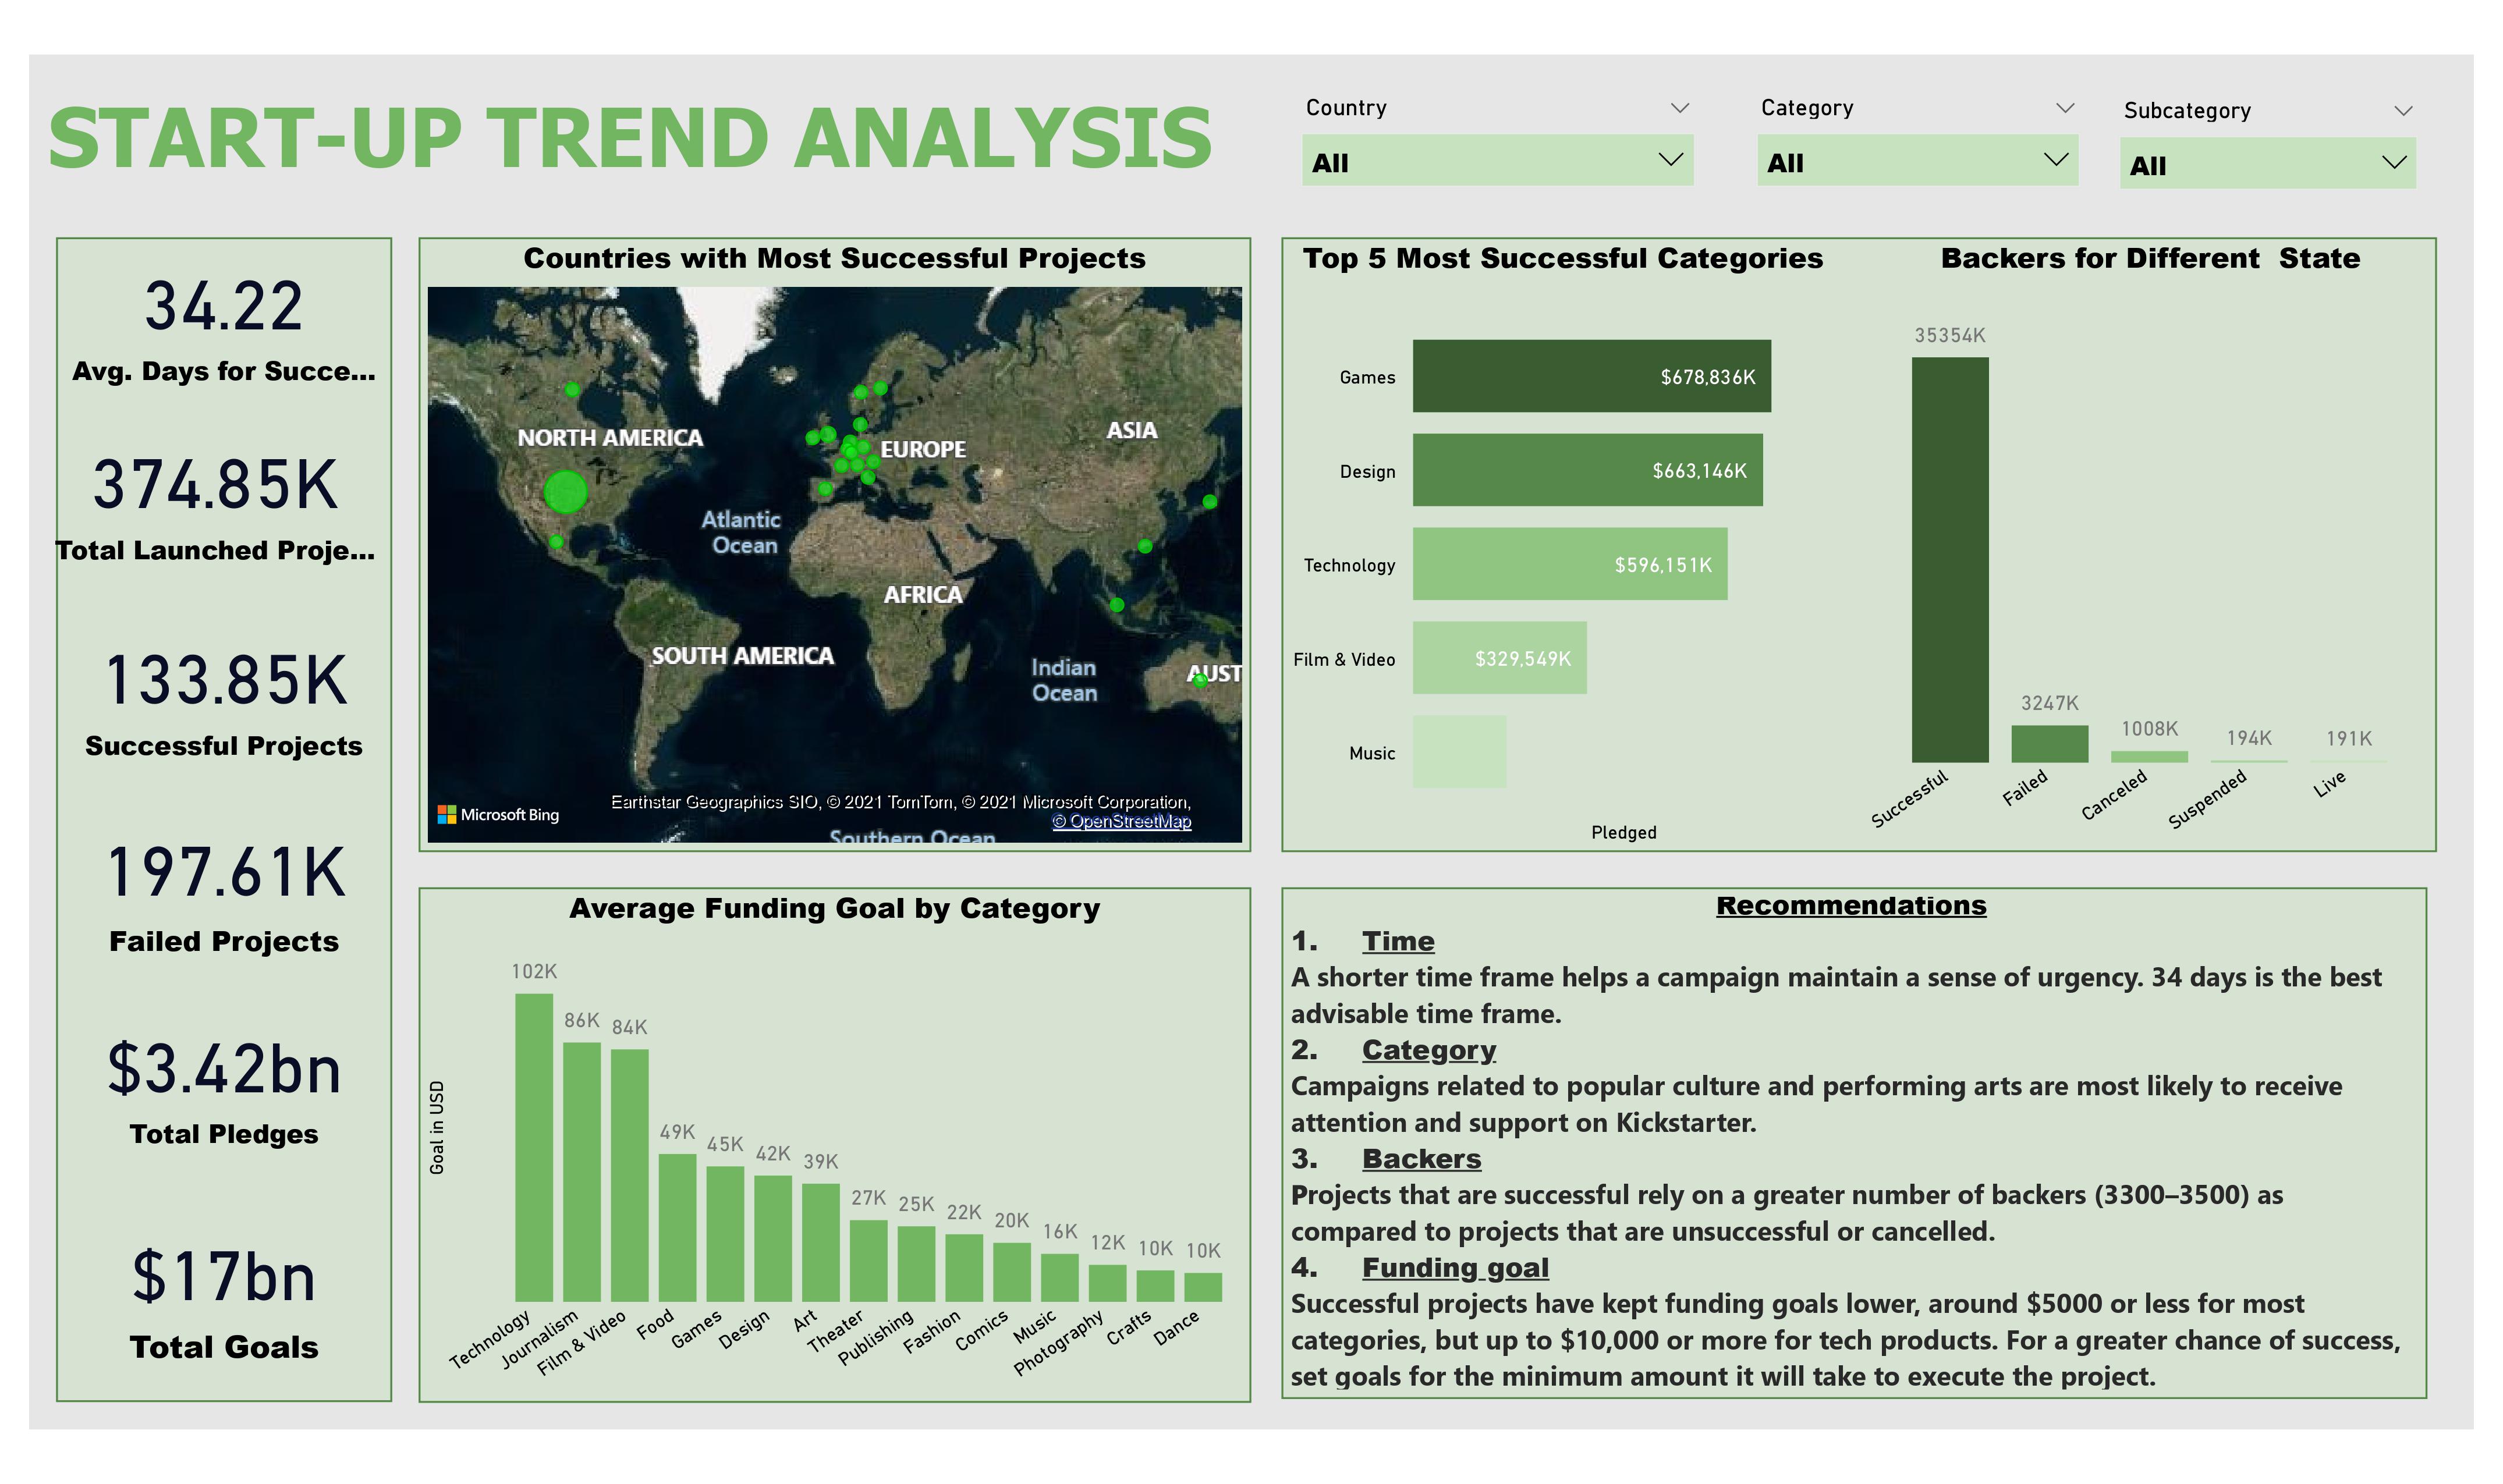
    Kickstarter Campaign Analysis with Microsoft Power BI

    Kickstarter is a global crowdfunding platform which helps creative projects to raise funding from backers. Project creators choose a deadline and a minimum funding goal. Projects must reach their funding goal, otherwise no money will be collected. People who back Kickstarter projects are offered tangible rewards such as custom editions and early releases of the projects as well as special experiences in exchange for their pledges. The platform is currently only open for project creators from a small selection of countries but project backing is available internationally.

    The objective of this project was to understand what factors make a Kickstarter campaign successful. The tools I utilized:

    • Power BI
    • DAX
    • Excel/CSV

    Get In Touch!

    Feel free to reach out to me via any of the social media outlets below with your questions and comments!